#StandWithUkraine - Stop the Russian invasion
Join us and donate. Since 2022 we have contributed over $3,000 in book royalties to Save Life in Ukraine & Ukraine Humanitarian Appeal & The HALO Trust, and we will continue to give!
Numbers-to-Text and Remove Characters
We often need clean-up skills when working with US Census Data and similar geographic files. The US Census publishes data for different levels of boundaries, such as states, counties, and census tracts, as described in the Guiding Questions for Your Search section of this book. Each of these geographic entities is uniquely identified by a Federal Information Processing System (FIPS) code. State-level FIPS codes are 2 digits (such as 09 for Connecticut), and county-level codes are 5 digits (such as 09003 for Hartford County, Connecticut, where the first 2 digits represent the state). Further down the hierarchy, each census tract has 11 digits (such as 09003503102, which consists of 2 digits for the state, 3 for the county, and 6 for the tract). Also, note that US Census tract boundaries change over time. The FIPS codes usually look similar over time, but deep down there may be significant changes in numbering and boundary lines from 2010 to 2020. For example, see Ilya’s richly-illustrated post about Connecticut Census Tract Boundaries are Changing from 2010 to 2020 on the CT Data Collaborative blog.
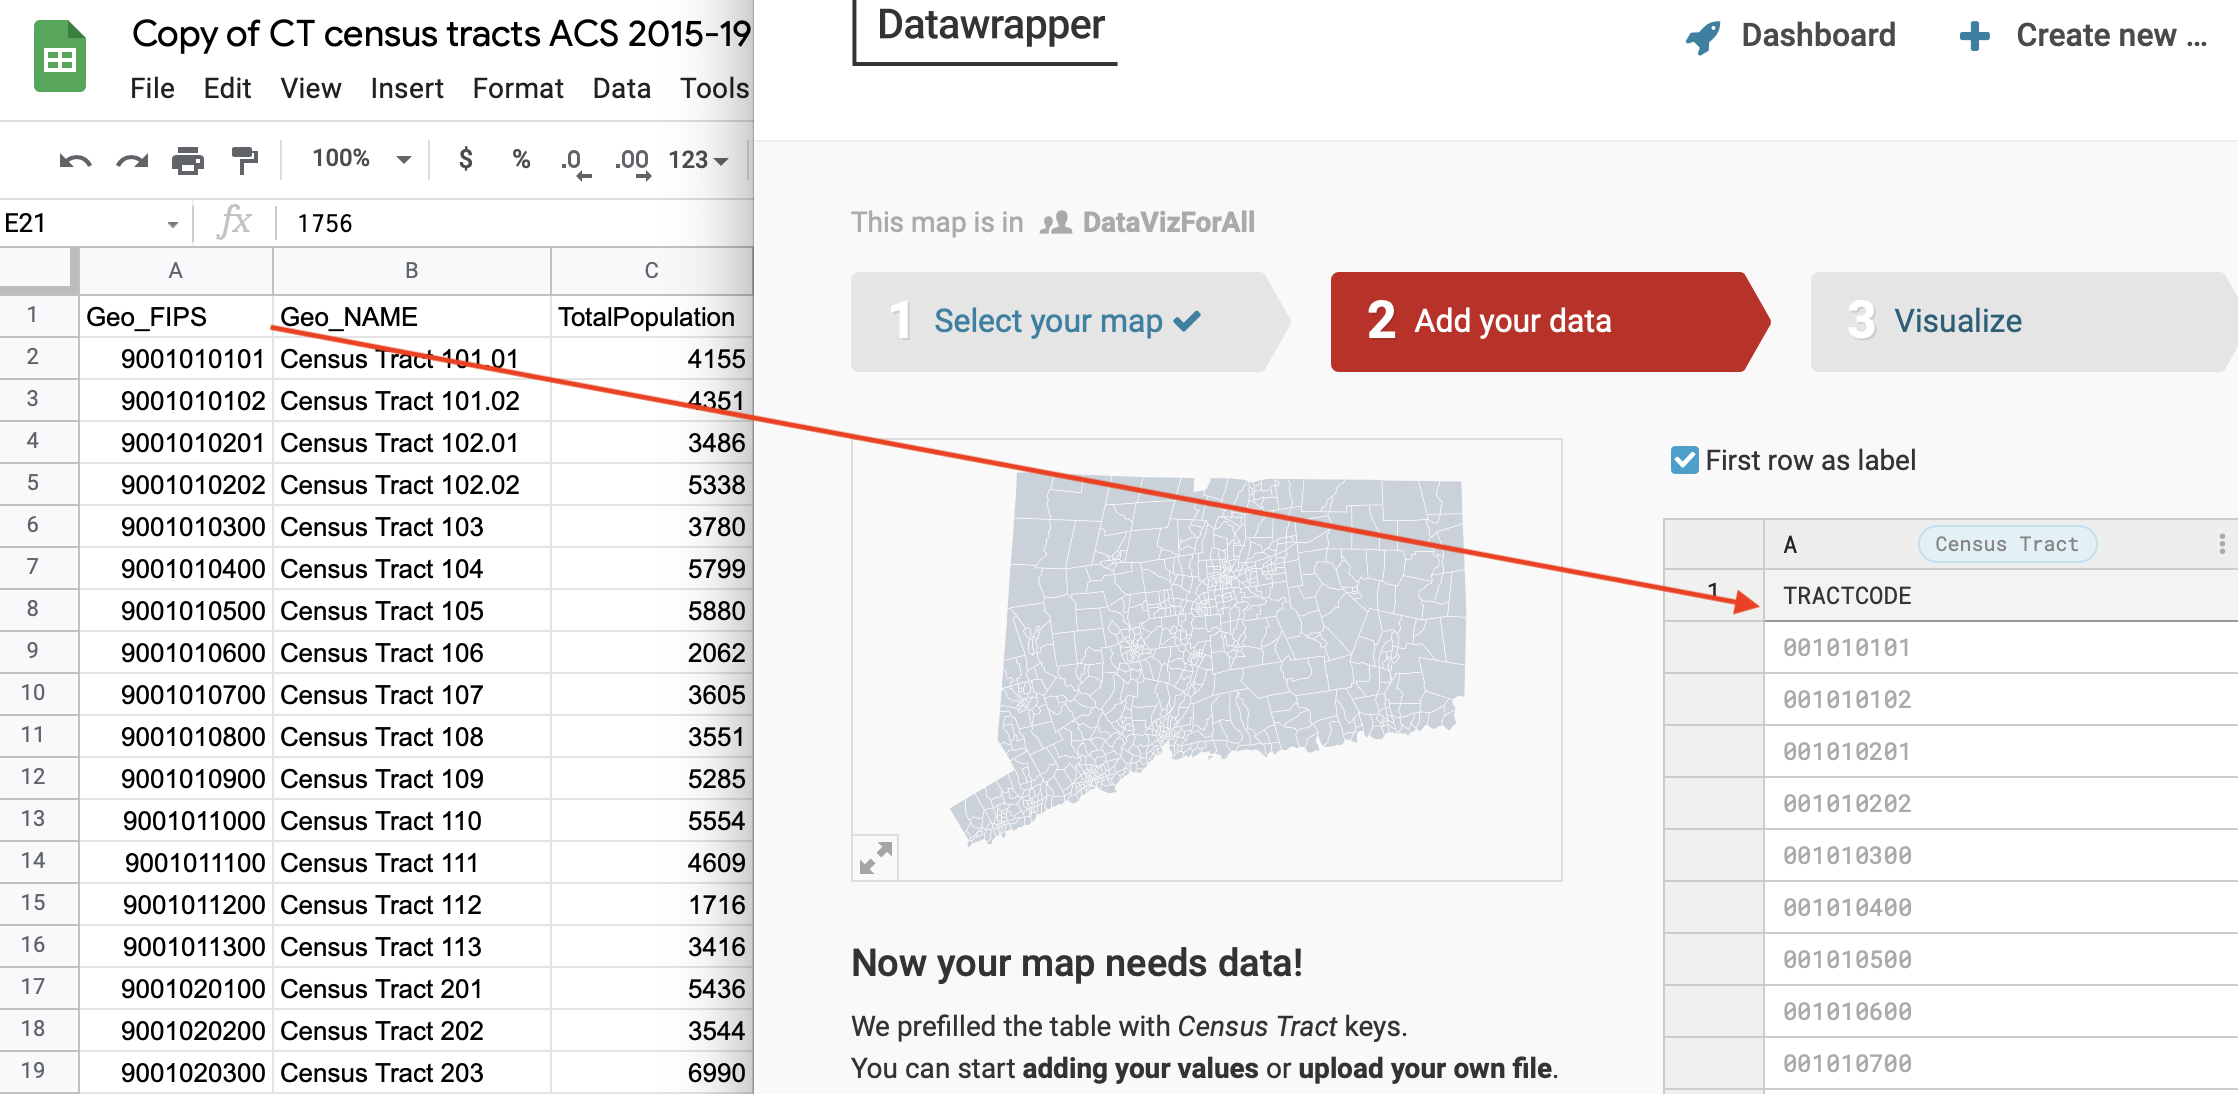
When preparing to make maps with US Census tract data, you typically need to match a long FIPS code from your spreadsheet to a corresponding code in your mapping tool. But sometimes these data columns do not line up and you need to do some cleanup. For example, compare the spreadsheet of US Census tract data (on the left) and the Datawrapper map tool census tract codes (on the right), as shown in Figure 4.8. The first entry on the left 9001010101 does not perfectly match the first entry on the right 001010101. We need to do a bit of data cleanup before we can match the data columns and begin mapping.

Figure 4.8: The census tract codes in the spreadsheet on the left do not match the codes in the mapping tool on the right.
In this example, we have two problems that require cleanup: format and length. The first problem is that the FIPS codes on the left side are formatted as numbers (which usually appear right-aligned in spreadsheets) while the codes on the left side are formatted as text or string data (which usually appear as left-aligned). If that was our only problem, we could fix it by selecting the column and changing it to Format > Number > Plain Text.
But the second problem is that the codes on the right side are 10 numeric digits while the tract codes on the left side are 9 text characters. Look closely and you’ll notice that the spreadsheet entries all begin with a 9, which does not appear in the mapping tool entries. Originally, the left side entries all began with 09, the FIPS code for Connecticut, but when the spreadsheet read this as numeric data, it dropped the leading zero, which explains why an 11-digit FIPS code appears here as a 10-digit code.
Fortunately, we can easily fix both problems with one spreadsheet formula. In Google Sheets, the =RIGHT formula converts a numeric value into a string (or text) value, and also returns only a specified number of characters, counting from the right side. In this example, we want to convert the 10-digit number 9001010100 into a 9-character text string without the 9 in front, so it becomes 001010100. Insert the formula =RIGHT(A2,9) in cell B2, where the 9 refers to the number of characters you wish to keep when counting from the right side, and paste it down the entire column, as shown in Figure 4.9.

Figure 4.9: The =RIGHT formula converts numbers to text, and keeps only the desired number of characters when counting from the right side.
Now the two data columns match perfectly and you can connect census tract data from the spreadsheet to the map tool to create a choropleth map, as described in Chapter 7: Map Your Data. See related Google Sheet formulas and functions.
Spreadsheets are great tools to find and replace data, split data into separate columns, combine data into one column, convert numeric to text data, and remove characters. But what if your data table is trapped inside a PDF? In the next section, we will introduce Tabula and show you how to convert tables from text-based PDF documents into tables that you can analyze in spreadsheets.